One of the most important aspects of data quality is being able to identify anomalies within your data. There are many ways to approach this, one of which is to test the data against Benford’s Law. This blog will take a look at what Benford’s Law is, how it can be used to detect fraud, and how the Datactics platform can be used to achieve this.
What is Benford’s Law?
Benford’s law is named after a physicist called Frank Benford and was first discovered in the 1880s by an astronomer named Simon Newcomb. Newcomb was looking through logarithm tables (used before pocket calculators were invented to find the value of the logarithms of numbers), when he spotted that the pages which started with earlier digits, like 1, were significantly more worn than other pages.
Given a large set of numerical data, Benford’s Law asserts that the first digit of these numbers is more likely to be small. If the data follows Benford’s Law, then approximately 30% of the time the first digit would be a 1, whilst 9 would only be the first digit around 5% of the time. If the distribution of the first digit was uniform, then they would all occur equally often (around 11% of the time). It also proposes a distribution of the second digit, third digit, combinations of digits, and so on. According to Benford’s Law, the probability that the first digit in a dataset is d is given by P(d) = log10(1 + 1/d).
Why is it useful?
There are plenty of data sets that have proven to have followed Benford’s Law, including stock prices, population numbers, and electricity bills. Due to the large availability of data known to follow Benford’s Law, checking a data set to see if it follows Benford’s Law can be a good indicator as to whether the data has been manipulated. While this is not definitive proof that the data is erroneous or fraudulent, it can provide a good indication of problematic trends in your data.
In the context of fraud, Benford’s law can be used to detect anomalies and irregularities in financial data. For example, within large datasets such as invoices, sales records, expense reports, and other financial statements. If the data has been fabricated, then the person tampering with it would probably have done so “randomly”. This means the first digits would be uniformly distributed and thus, not follow Benford’s Law.
Below are some real-world examples where Benford’s Law has been applied:
Detecting fraud in financial accounts – Benford’s Law can be useful in its application to many different types of fraud, including money laundering and large financial accounts. Many years after Greece joined the eurozone, the economic data they provided to the E.U. was shown to be probably fraudulent using this method.
Detecting election fraud – Benford’s Law was used as evidence of fraud in the 2009 Iranian elections and was also used for auditing data from the 2009 German federal elections. Benford’s Law has also been used in multiple US presidential elections.
Analysis of price digits – When the euro was introduced, all the different exchange rates meant that, while the “real” price of goods stayed the same, the “nominal” price (the monetary value) of goods was distorted. Research carried out across Europe showed that the first digits of nominal prices followed Benford’s Law. However, deviation from this occurred for the second and third digits. Here, trends more commonly associated with psychological pricing could be observed. Larger digits (especially 9) are more commonly found due to the fact that prices such as £1.99 have been shown to be more associated with spending £1 rather than £2.
How can Datactics’ tools be used to test for Benford’s Law?
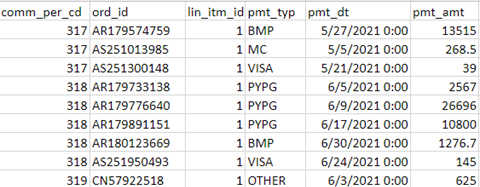
Using the Datactics platform, we can very easily test any dataset against Benford’s Law. Take this dataset of financial transactions (shown below). We’re going to be testing the “pmt_amt” column to see if it follows Benford’s Law for first digits. It spans several orders of magnitudes ranging from a few dollars to 15 million, which means that Benford’s Law is more likely to accurately apply to it.

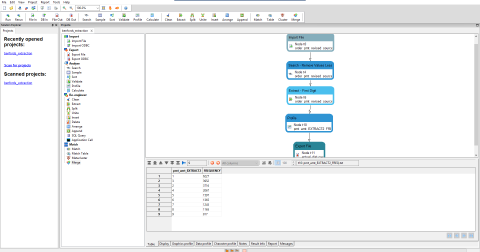
The first step of the test is to extract the first digit of the column for analysis. This can very easily be done using a small FlowDesigner project (shown below).

Here we import the dataset and then filter out any values that are less than 1, as these aren’t relevant to our analysis. Then, we extract the first digit. Once that’s been completed, we can profile these digits to find out how many times each occurs and then save the results.
The next step would be to perform a statistical test to see how confident we can be that Benford’s Law applies here. We can use our Data Quality Manager tool to architect the whole process.

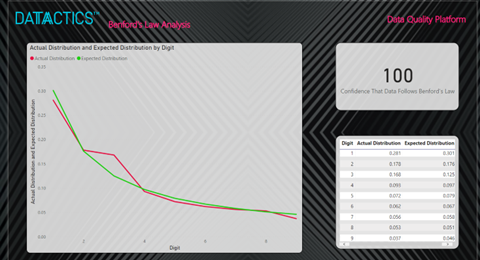
Step one runs our FlowDesigner project, whilst the second executes a simple Python script to perform the test and the last two steps let us set up an automated email alert to let the user know if the data failed the test at a specified threshold. While I’m using an email alert here, any issues tracking platform, such as Jira, can be used. We can also show the results in a dashboard, like the one below.

The graph on the left, with the green line, represents the distribution we would expect the digits to follow if it obeyed Benford’s Law. The red line shows the actual distribution of the digits. The bottom right table shows the two distributions and then the top right table shows the result of the test. In this case, it shows that we can be 100% confident that the data follows Benford’s Law.
In conclusion…
Physicist Frank Benford discovered a useful methodology that is as beneficial today as ever. The applicability of Benford’s law is a powerful tool for detecting fraud and other irregularities in large datasets. By combining statistical analysis with expert knowledge and AI-enabled technologies, organizations can improve their ability to detect and prevent fraudulent activities, thus safeguarding their financial health and reputation.

Matt Neil is a Machine Learning Engineer at Datactics. For more insights from Datactics, find us on Linkedin, Twitter or Facebook.
